
6. The debugger
JNEXT ships with a full source-less debugger for ZX Spectrum Next software: it halts the machine at an instruction boundary and shows you the CPU, the memory map, every video layer, the Copper program, the NextREG file and the AY registers, all as the hardware sees them at that instant.
This chapter is a reference. Each panel and each function has its own section, so you can look one up while you are debugging.
Open the debugger with Alt+D, with Debug ▸ Debugger or View ▸ Debugger (the same entry, in both menus), or with the bug button on the emulator toolbar. The same actions close it. While it is closed the debugger costs nothing — no breakpoint checking, no call-stack tracking, no panel refreshes. Closing it also resumes the machine if it was paused.
The debugger opens in its own window, positioned to the right of the emulator window. It has its own menu bar — Debug, Map, Breakpoints, Watches and Window — and a control toolbar along the bottom.
Window ▸ Attach to emulator window keeps it pinned to the emulator's right-hand edge as you drag or resize that window; the setting is remembered between sessions. This needs a window system that lets an application position its own windows, so it works on X11 and is unavailable on Wayland, where the menu item is greyed out. That is not something JNEXT can work around: Wayland's window-management protocol has no request for an application to place its own window — placement belongs entirely to the compositor. To get attachment under a Wayland session, run JNEXT on XWayland's X11 interface:
$ QT_QPA_PLATFORM=xcb jnext
A native XWayland session reports itself as xcb and so looks like X11 from
inside the application, while the compositor still discards the moves. JNEXT
therefore checks whether its moves actually land, and if several in a row are
ignored it stops trying, unticks the menu item and says so in the status bar.
Re-tick it to retry. That automatic stop does not change your saved
preference.
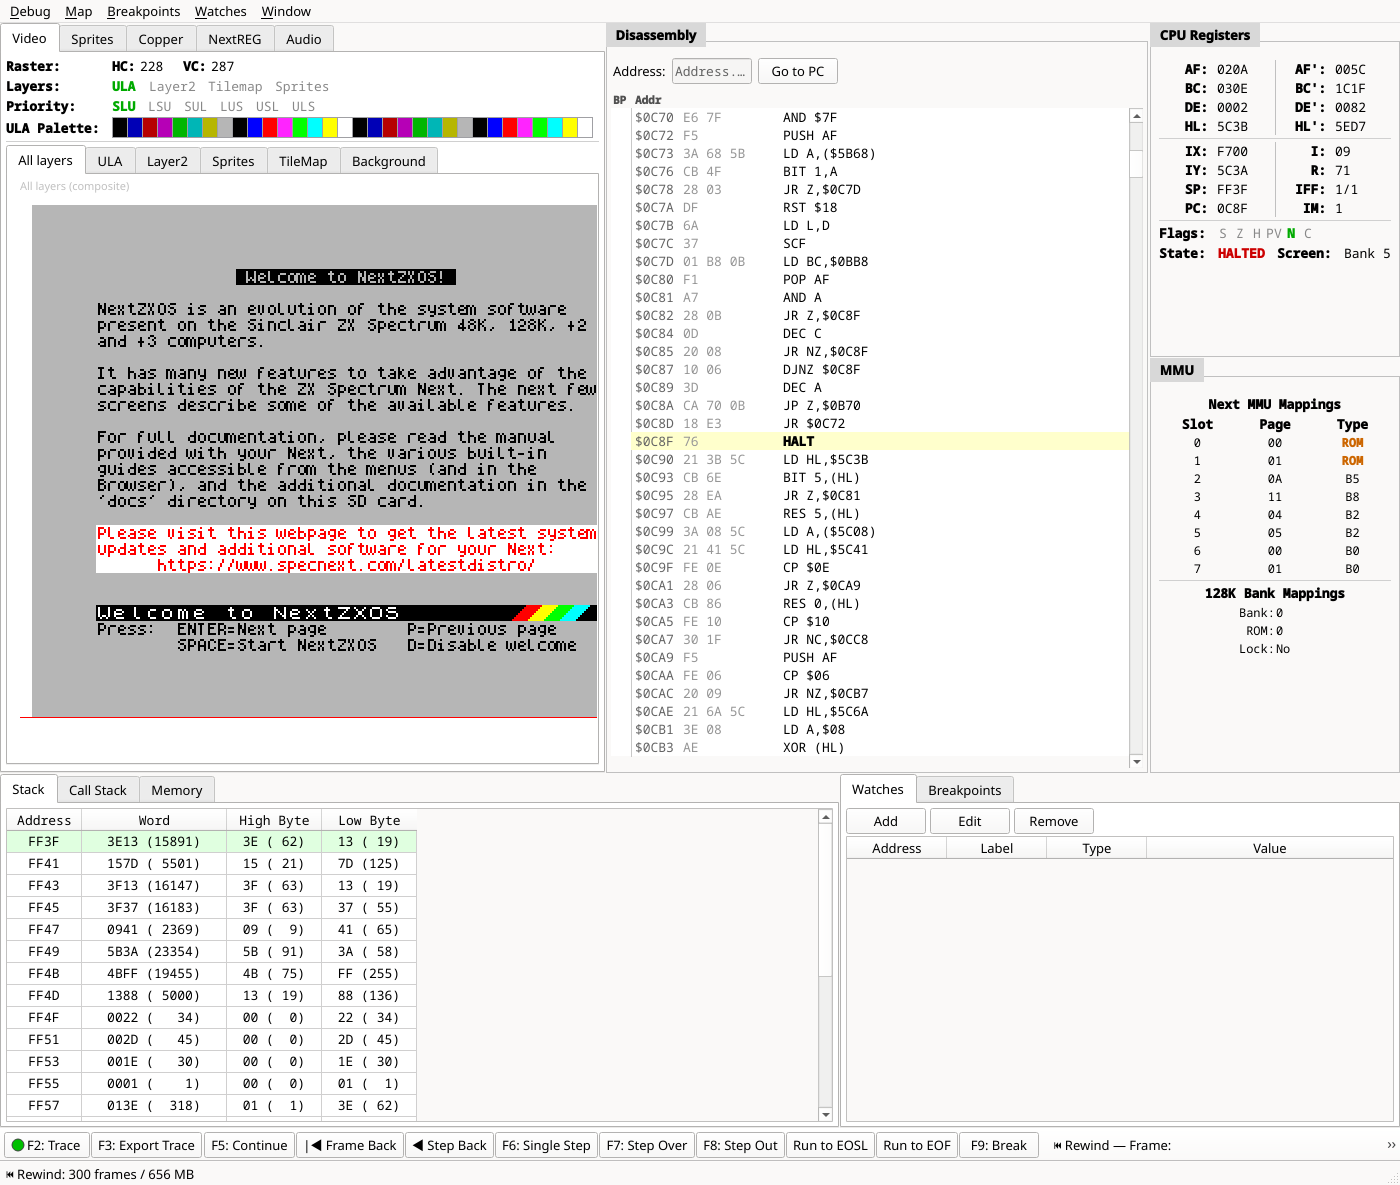
The layout is fixed: video-related tabs on the top left, disassembly in the centre, CPU registers and MMU down the right, and memory/stack tabs and watch/breakpoint tabs along the bottom. The splitters between the areas can be dragged.
The window itself can be made smaller than the panels need. When it is, the panel area gains scrollbars and pans instead of cutting anything off, and the control toolbar along the bottom stays put — buttons that no longer fit move into a » overflow menu at its right-hand end. The size is remembered between sessions, and is clamped to the screen it reopens on, so a window saved on a large monitor never comes back unreachable on a small one.
Four panels — CPU Registers, Disassembly, Stack and Call Stack — only show data while the machine is paused, and are greyed out while it runs. That is deliberate: reading them every frame would slow the emulation down for no benefit, since the values would be a blur. The rest refresh about four times a second while the machine is running.