
Breakpoints
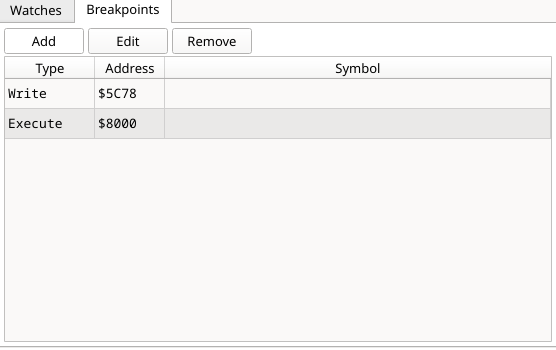
Every breakpoint in one list, sorted by address: an On checkbox, the type,
the address and — with a MAP file loaded — the symbol at that address, or with
a source map the source line. The Add dialog takes a symbol or, for an Execute
breakpoint, a source line (main.bas:120); see
Breakpoints on a source line.
Add, Edit and Remove manage them; double-clicking a row edits it.
The list, the disassembly gutter and the Source tab's BP column stay in sync in both directions.
A breakpoint qualified with the memory its opcode comes from reads $8005 P04 or
$0008 DIVROM in the address column
(which memory an address is in); the @14
of $C000 @14 is another client's page qualifier (a DZRP or script breakpoint), which
is a different thing.
Whose breakpoints the gutters show and change
Every breakpoint belongs to whoever set it. The debugger window is one owner; GDB
(z88dk-gdb, a GDB-protocol client), ZRCP, DZRP (DeZog in VS Code) and a debugger script are
others, each its own. They all stop the same machine, and the Breakpoints panel lists all
of them together, but the breakpoint column of the Disassembly and of the Source tab draws
and edits only the debugger window's own breakpoints:
- Drawing. A red dot or ring in either column is a breakpoint this window set (a gutter
click, Toggle Breakpoint, the Add dialog, the Breakpoints menu). An Execute breakpoint
that GDB, ZRCP, DeZog or a script set at the same address draws nothing there. It is a row in
the Breakpoints panel, marked
(client N)after its type, read-only: its On box cannot be ticked, and Edit and Remove refuse it. - Clicking. A click on a line that carries only someone else's breakpoint adds the window's own breakpoint beside it (two rows in the list, the line now shows a dot) and does not touch the other. A click on a line with the window's own breakpoint removes that one only. The window never removes another client's breakpoint, from a gutter, from the right-click menu, from Remove or from Clear All Breakpoints (which clears only the window's own).
- Seeing and removing the others. Read them in the Breakpoints panel. To remove one, use the
tool that set it (
deletein GDB, the breakpoint list in DeZog, the ZRCP command, the script). The Breakpoints enabled master switch below is shared: unticking it suspends every owner's breakpoints. - Data breakpoints (Read, Write, ports) are not drawn in the gutters at all, whoever owns them.
Turning breakpoints off without losing them
Deleting a breakpoint to get past it, and typing the address back in afterwards, is the thing this panel exists to stop.
- The On checkbox on a row disables just that breakpoint. It stays in the list with its address and type; it simply does not fire. Tick it again and it is back exactly as it was. Every breakpoint is created enabled, from every route — the Add dialog, the Breakpoints menu, a gutter click or the disassembly's right-click menu.
- Breakpoints enabled, next to the buttons, is the master switch. Unticking it suspends every breakpoint and watchpoint at once, and ticking it back restores each one to its own On state — the individual checkboxes are left alone while it is off, which is what makes the round trip exact. Use it to let a program run through a session's worth of breakpoints and then pick up where you left off.
Step Into, Step Over, Step Out and Run to Here keep working while the master switch is off, so a suspended machine is still one you can walk through.
Watchpoints watch the program, not you
A read or write watchpoint fires on an access made by the program you are running. Looking at the same address — keeping it in the Watches panel, scrolling the Memory panel over it, having it in the displayed part of the stack — is not an access and never stops the machine, however often the panels refresh. Saving a snapshot does not trip one either.
So you can safely watch an address in a panel and watchpoint it at the same time, which is usually what you want to do.
In the disassembly gutter and the Source tab's BP column, a suspended breakpoint — individually disabled, or any breakpoint while the master switch is off — is drawn as a hollow red ring instead of a filled red dot. It stays visible, in the same place, so you can still see where your breakpoints are; it just does not look armed.