
In the Source tab: names, watches, coverage and colours
Things that work from the Source tab beyond stepping. The tab's controls are in its panel page.
C names
A z88dk C variable or function has an underscore in front of its name in the
map (_counter). JNEXT shows and accepts the C name:
counterworks wherever_counterdoes: the Add dialogs of the Breakpoints and Watches panels, Go to Address in the Disassembly and Memory panels, and a script's@counter;- the views show
counter.
A number wins over a symbol in an address field: FE or B is that address even
when the program has a variable of that name. Write @FE to mean the symbol.
Your own labels and comments
Right-click a source line and Add Label… names the address it compiled to (a line with several
places asks which); Add Comment… attaches a note to it. They are kept in a .jdp file with
Map ▸ Save Annotations, belong to the memory the line was compiled for, and show in the
Disassembly. See Your own labels and comments.
Watching and breaking from the source
In the example of A first session, right-click counter on line 20
and choose Watch: it joins the Watches panel under its C name. Break on
Write from the same menu stops the machine whenever the program writes it. What
the menu offers, and for what under the pointer, is described in the panel page's
right-click menu.
A write breakpoint on counter is listed in the Breakpoints panel by its C name, next to the
line breakpoint on main.c:19:
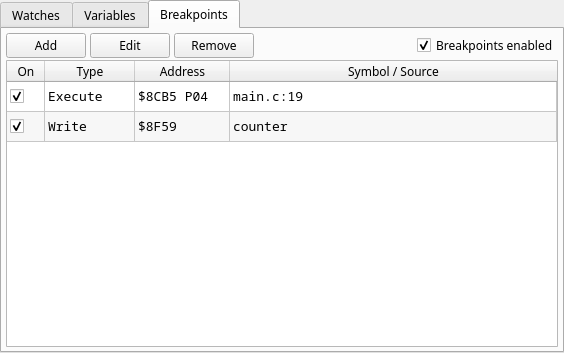
The address column spells $8CB5 P04 for the line, which is in RAM page 0x04
(banked code), and $8F59 for the variable.
Which lines have run
Switch on memory coverage and every line of the shown file that has run gets a
tinted background; the current line keeps its own highlight. Use Debug ▸
Coverage ▸ Enable Coverage, or start JNEXT with --coverage to record from the
first instruction. Marks are visible while the machine is paused, like the rest
of the debugger.
It answers "did this code ever run?" without a breakpoint. In the example,
enable coverage while the machine is paused at the start, add a breakpoint on
main.c:26 and Continue: the lines of main before it are tinted, and counter++ in the final
while (1) is not, since it has not run yet. Coverage is kept per physical
memory, so the same address in two RAM pages has separate marks. All of it is in
Memory coverage.
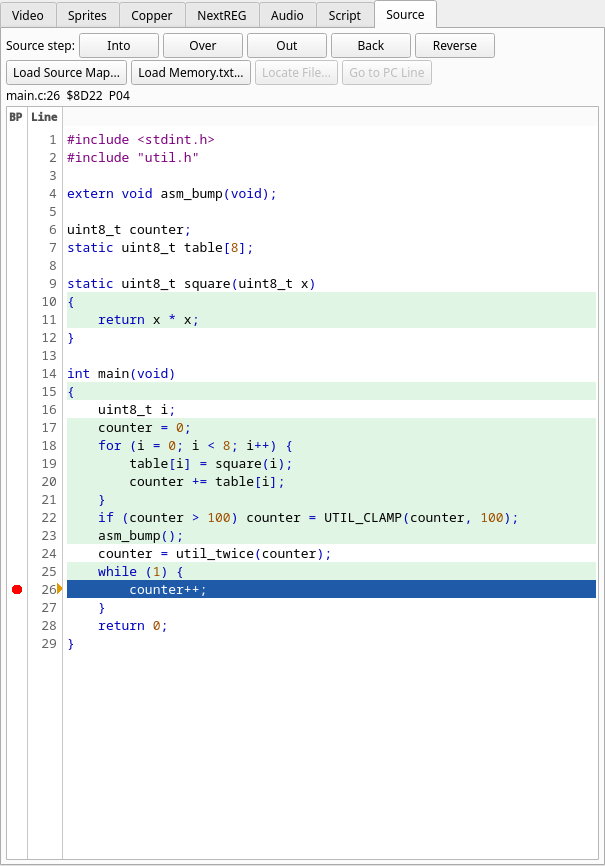
The picture is that run on the z88dk 2.4 build. Line 24, counter = util_twice(counter);, did
run but is not tinted: this build puts its code under line 25 (the two lines start at the same
address, $8D12, and the later one owns it), so line 25 is tinted for it. This is the toolchain's
line attribution again, as in A first session.
Colours
The text is coloured by its language (C, Z80 and Z80N assembly, Boriel ZX Basic), and the colours
come from a scheme: Auto (the default, Light or Dark after the application's theme), Light,
Dark or Borland C++ 3.1. Choose it in Preferences ▸ Debugger, or for one run with
--set source.colour_scheme=auto|light|dark|borland; it applies at once, and is stored as
colour_scheme in the [source] section of the configuration file. The scheme sets the text, the
background, the current-line bar and the coverage tint, which is pale green in Light, a dark
green in Dark and a dark teal in Borland. The same stop as above in the Borland scheme:
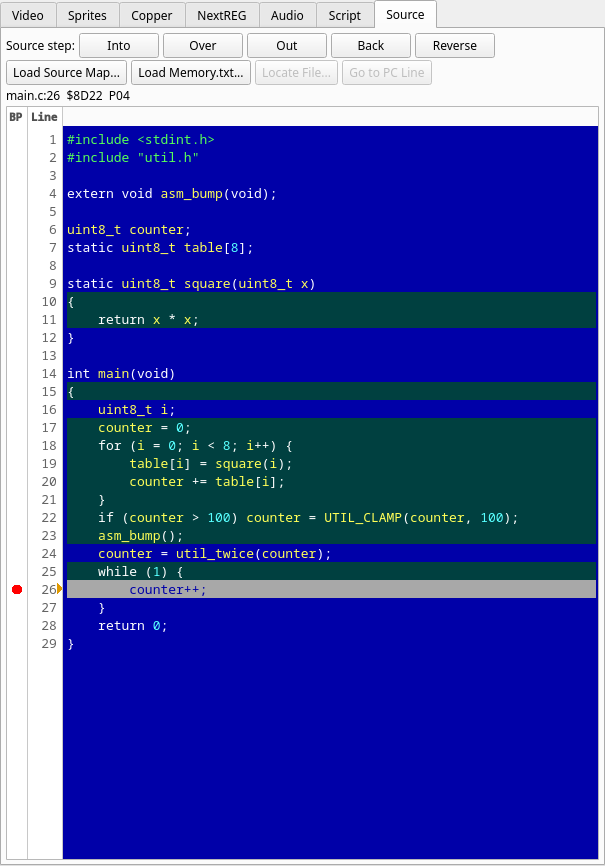
The ten colour classes and what each one covers are in the panel page, the Source tab; the setting is in Preferences.
Following the disassembly
The Source tab and the Disassembly follow each other's selection, and a small amber arrow marks the
line the CPU is on. When a toolchain attributes the same address to more than one source line, the
position line lists the others after also:. All three are described in the panel page's
Following the disassembly.